Live Data
Solar-powered, live data fills in the details.
The Lilly Center has studied 12 local freshwater, all-sport lakes weekly through the summer since 2007. Year-round since 2014, we’ve studied the major streams surrounding six of these lakes. That’s a lot of data, but until 2018, we didn’t have as complete a picture of the local waterways as we’d like.
Now, with these stream sensors, we have live data at our fingertips to fill in the details!
Live Stream Data
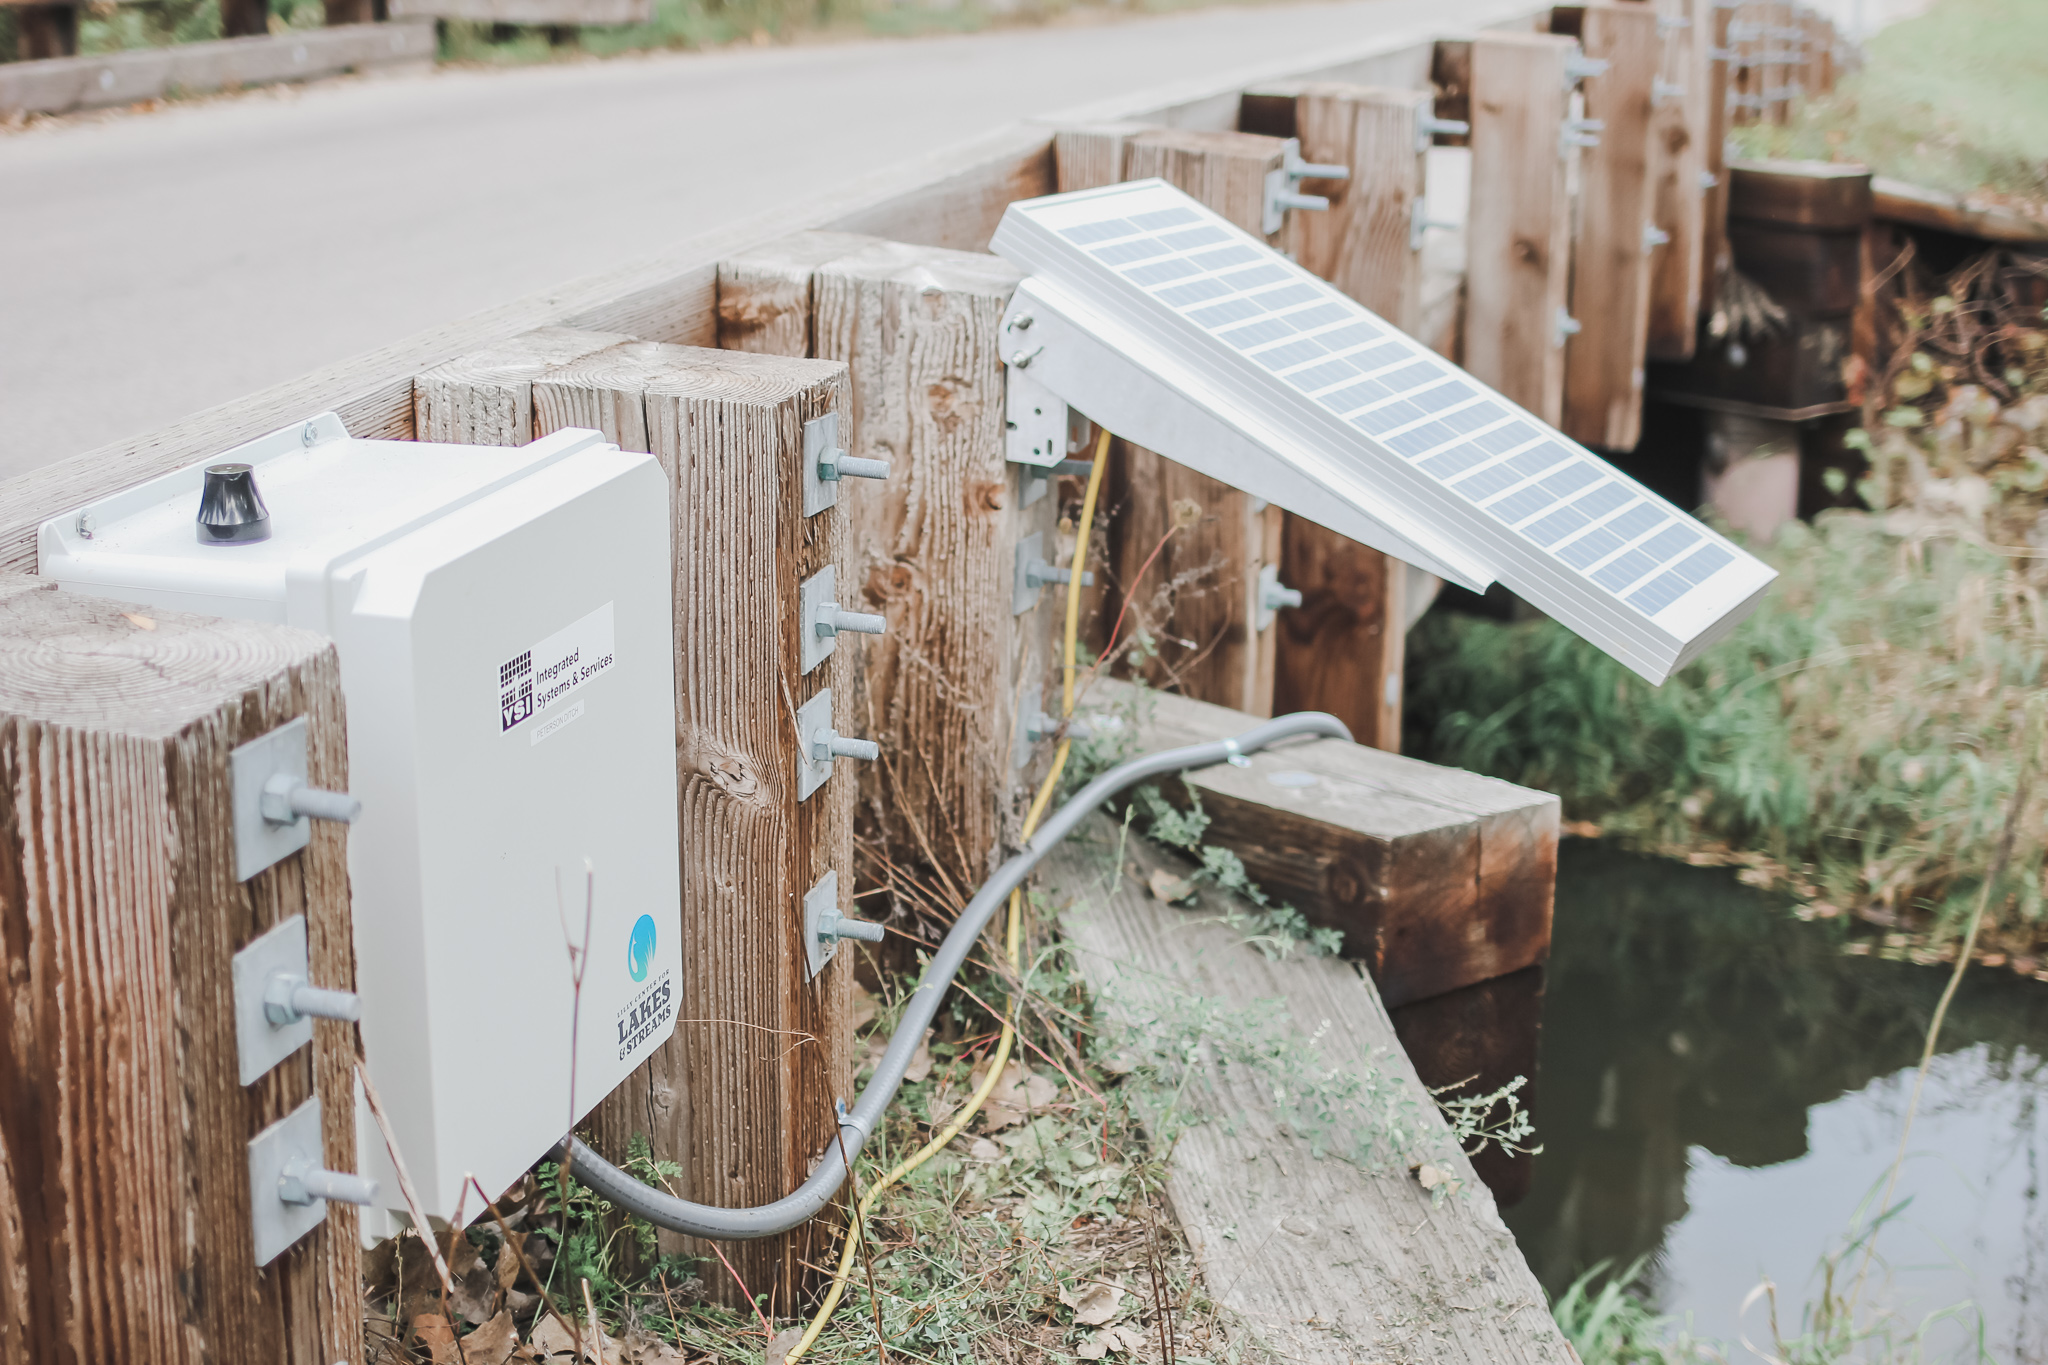
These 14 stream sensors are installed at 14 inflowing and outflowing stream sites around Winona, Pike, Wawasee, Syracuse, Tippecanoe, Oswego and James lakes.
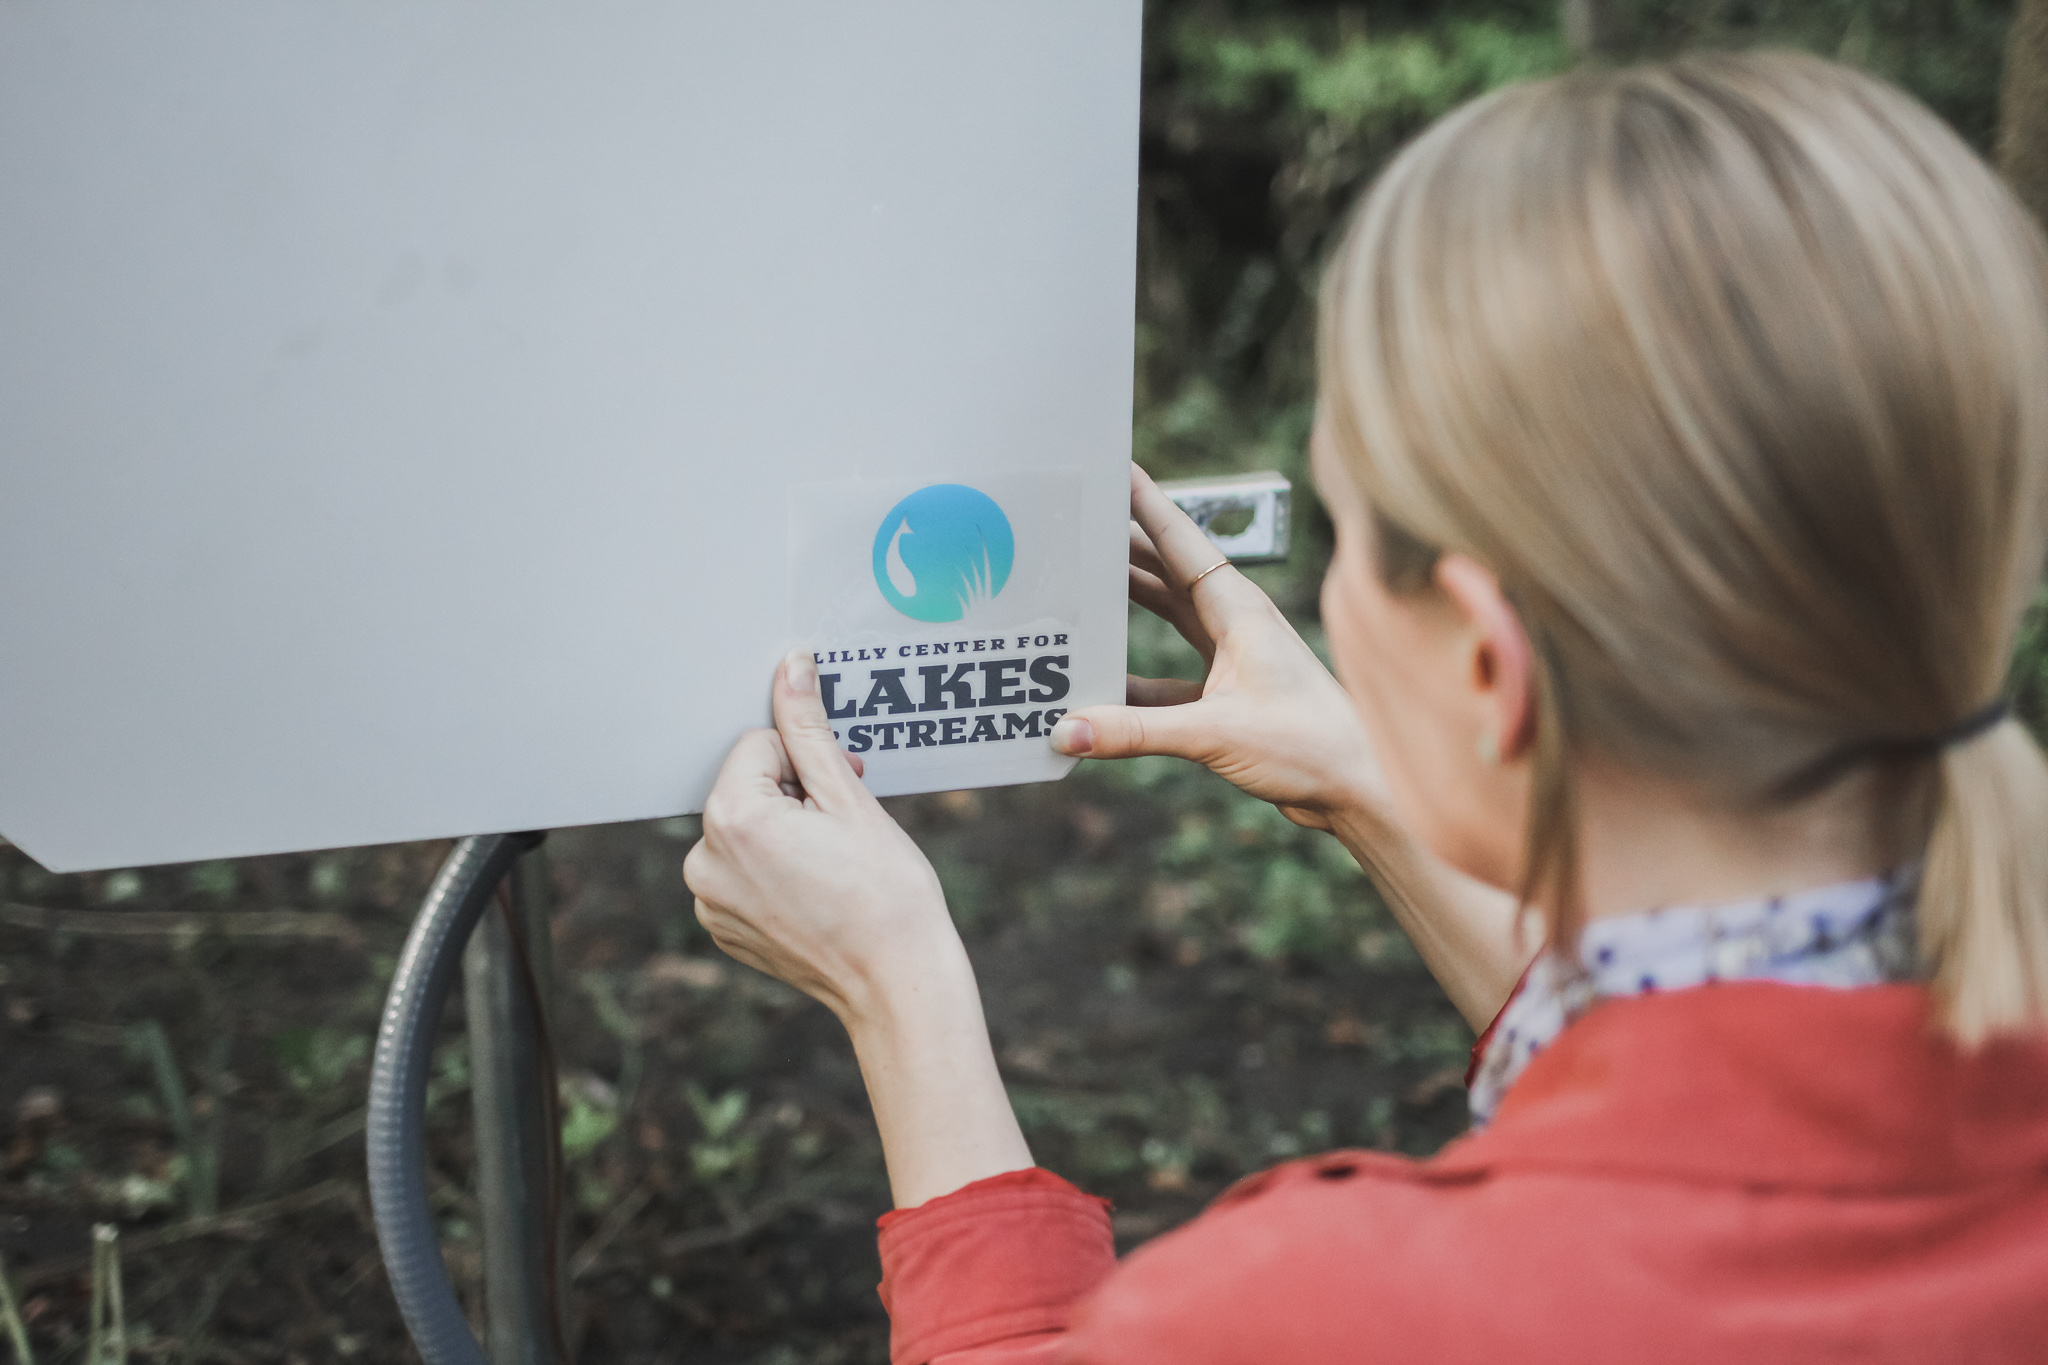
Our stream sensors consist of two main parts: the sensor that sits in the stream and the box, mounted outside of the stream, that receives and sends out the data.
The sensor is solar-powered and uses Doppler technology to measure how fast particles are moving through the water around it. The sensor also knows the shape of the stream all round it, which we calculated and uploaded to the equipment while installing it. Using the shape and speed of the water at various points across the stream, the sensor calculates the volume of water moving through the stream every second. The monitor also measures a variety of other valuable features of the water, such as the temperature and the total depth of the stream.
With all this live data, the Lilly Center can assess many aspects of lake health. To this point, we’ve studied:
- Boating impacts
- Starry stonewort
- Zebra mussels
- Economic impacts
- Watershed contributions
- Historical trends
- Blue-green algae toxins
- Changing water levels
With four trained aquatic scientists and many dedicated science students on our staff, coupled with your investment, the flow sensors are a strategic expansion of our research expertise and equipment. They will help determine the most effective actions for your lake going forward.
Parameters
We use the stream sensor to monitor many aspects of these streams, including the following. You’ll see flow, velocity and depth displayed on the individual stream pages. Use the following definitions to navigate the site:
Water Flow: Volume of water moving through the stream over a set amount of time. (We measure flow rate in cubic feet per second.)
Water Depth: Stream depth, measured in feet.
Water Velocity: Average speed of the water since the last reading, measured in feet per second.
Water Temperature: Temperature of the water in Fahrenheit.
IQ System Status: This isn’t about the stream; it’s a binary parameter showing whether or not our system is operating!
System Battery: This displays the current voltage of the batteries that power the flow monitors. This is important for us to monitor at the office to make sure the solar panels are functioning properly and that the system has continual power.
Air Temperature: Temperature of the air around the transmitter in Fahrenheit. (Essentially, air temperature.)
Have a question about stream sensors?
Contact Joel Petrie, research technician at the Lilly Center.