Beneath the Surface
Beneath the Surface
You probably love your lake and want to preserve it for future generations – so does our team!
Beneath the Surface will equip you with information that will give your family, organization or agency the ability to care for the lakes. A special thank you to The Papers and the Renda family for making this publication possible.
The Lilly Center launched back in 2007. We believe that a countywide lakes culture needs countywide research, education, and collaboration, so our team crafts original content for those in kindergarten through retirement. Due to the Lilly Center’s work, the lakes in Kosciusko County are some of the best studied in Indiana.
We have a library of valuable data that shows patterns and trends in the health of our lakes, which in turn reveals specific management steps. That’s part of the design of this report. After looking at the data, we encourage you to follow the action steps on page 49 and share it with others. A digital copy can be downloaded below.
We invite you to dive Beneath the Surface with us! Keep scrolling to see the combined data and analysis from this year’s report.
Water Clarity
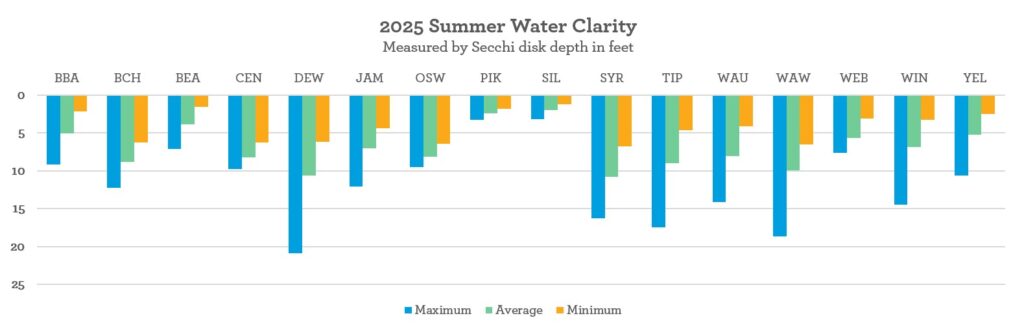
Measuring a lake’s clarity is just one way scientists determine the health of a lake. However, a clear lake is not always a clean lake. Harmful toxins can be hiding in a clear lake, while a lake with cloudy water may contain a thriving ecosystem. Invasive species like zebra mussels can make your lake clearer but encourage blue-green algae growth.
The Secchi disk graph below shows the maximum, average, and minimum depths we observed at each lake during the summer of 2025. The average of all Secchi disk readings was 7.0 ft. This average is about one foot deeper than the average in 2024 (5.9 ft) and similar to 2023 (6.7 ft). Water clarity varied within each watershed; the clearest lakes were in the Great Lakes watershed (Dewart, Syracuse, Waubee, and Wawasee). The average Secchi depth for these lakes was 9.9 ft compared to 3.7 ft in the county’s southern-most lakes in the Lower Tippecanoe watershed area. Silver Lake, which flows into the Eel River and eventually into the Wabash River, had an average Secchi depth of 2.0 ft.
Water clarity in the lakes of the Upper Tippecanoe watershed averaged 7.0 ft, but lakes in the Middle Tippecanoe watershed averaged 6.6 ft. This is a noticeable distinction in water clarity the further downstream these lakes are in the Tippecanoe watershed. Except for Beaver Dam and Yellow Creek, the lakes in the southern part of the county are relatively shallow and appear more eutrophic than many other lakes in Kosciusko County. This difference in water clarity could be due to the type of land use, the amount and quality of wetlands, as well as conservation efforts targeted to reduce nutrient
Dissolved Oxygen
Understanding dissolved oxygen is key to lake health — and good fishing! When enough dissolved oxygen is present in a lake, it can support a complex and diverse ecosystem. Turnover, the process where wind and wave action recharges a lake’s oxygen supply through mixing, happens twice a year. Turnover allows fish to survive winter and successfully reproduce in the spring.
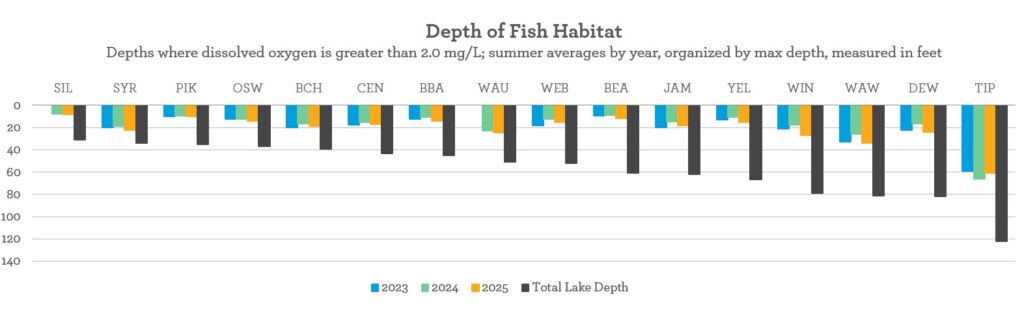
The lakes in this graph are organized from shallowest to deepest at their deepest point. Fish require at least 2.0 mg/L of oxygen in the water to survive; however, many fish species require three or more times that amount of oxygen to thrive and spawn. The bars in this graph represent the depth of fish habitat where dissolved oxygen is greater than or equal to 2.0 mg/L of oxygen.
The depth of dissolved oxygen averaged 21 ft in 2025. While dissolved oxygen depths do not vary much within each lake across years, dissolved oxygen depths differ, similar to water clarity, between watersheds. The lakes in the Upper Tippecanoe (26.5 ft) and Great Lakes (26.3 ft) watersheds had the best dissolved oxygen levels.
On the other hand, the more eutrophic lakes in the Lower Tippecanoe watershed, further south in the county, exhibit an average fish habitat depth of only 11.9 ft. Lakes in the Middle Tippecanoe watershed showed depths of dissolved oxygen averaging 18.2 ft.
Algae play a vital role in lake ecosystems by producing dissolved oxygen through photosynthesis, supporting aquatic life like fish. When too many nutrients — mainly nitrogen and phosphorus — enter a lake, they can trigger dense algal blooms. When these blooms die and decompose, they use large amounts of oxygen, leading to low-oxygen conditions that stress and even kill fish. Reducing nutrients helps prevent harmful blooms and maintain a healthy oxygen balance.
Is dissolved oxygen different from "regular" oxygen?
Nope! Dissolved oxygen simply refers to the molecule’s state when it’s mixed into lake water. Fish are able to draw dissolved oxygen through their gills; the roots of aquatic plants can absorb it, too.
Nutrients
During the spring and fall, our lakes experience turnover — the mixing of the top and bottom layers of the lake (the epilimnion and the hypolimnion). But what about the summer months? The warm surface water separates from the cold water below. Our field research team takes samples from both layers to look at a lake’s full nutrient profile. Nutrients like phosphorus and nitrogen are the “limiting factors” in our lakes. Finding ways to limit these nutrients is key to improving a lake’s health.
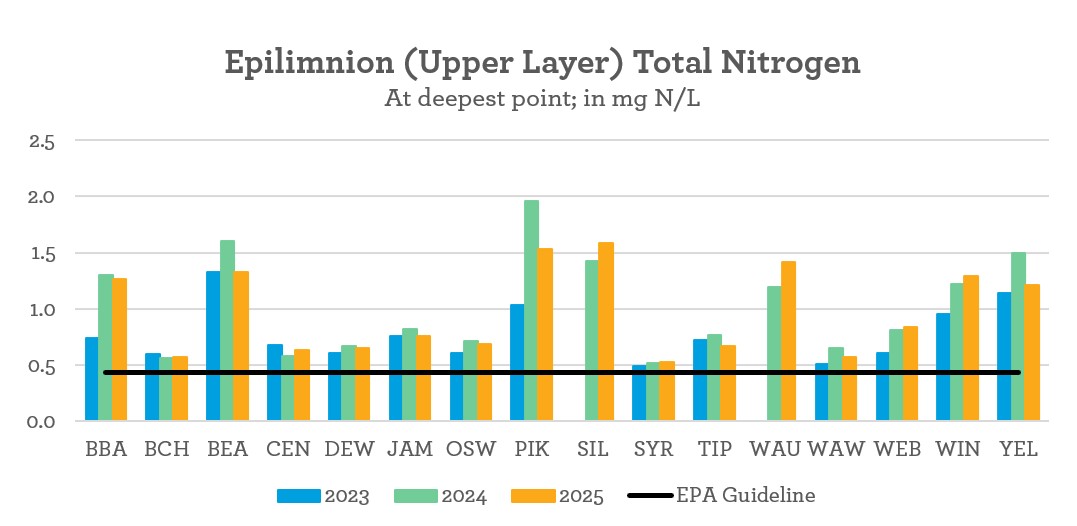
The black bar on each graph shows the threshold that the Environmental Protection Agency (EPA) designates as a water quality guideline for a minimally impacted lake in our ecoregion. Although it is a low bar, it is a high goal! All of our lakes need help to reduce the nutrient load they receive from runoff, decomposition, and fertilizer use.
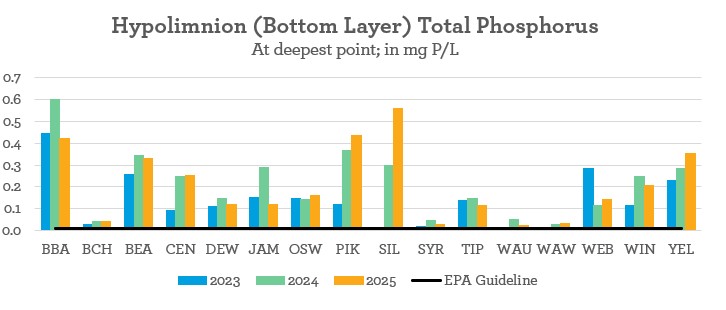
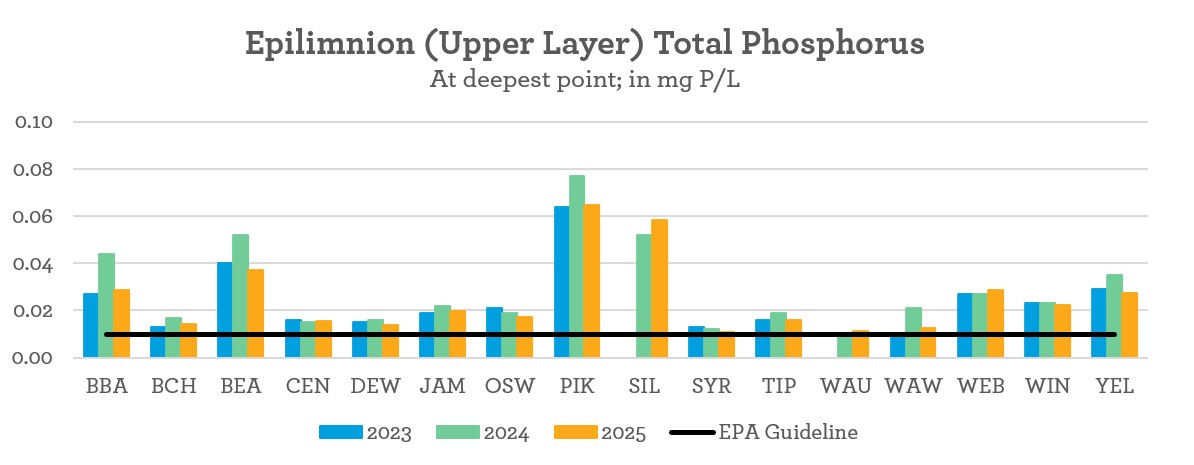
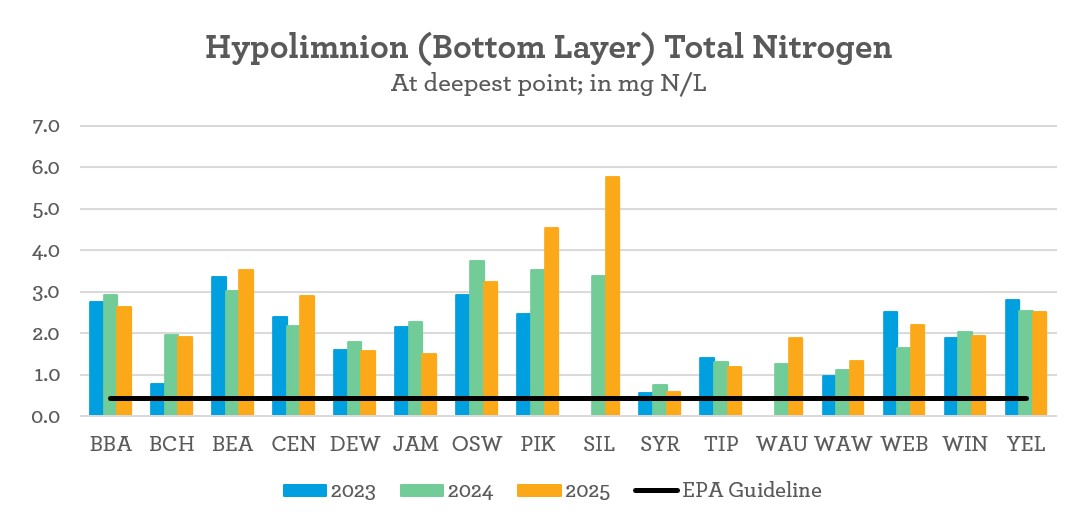
Note that the scales on these graphs are different, highlighting the fact that there are typically more nutrients in the hypolimnion than epilimnion in our lakes. That indicates that nutrients are coming from the bottom sediments of the lakes in addition to inflowing streams.
Phosphorus levels in Kosciusko County lakes do not meet the EPA’s acceptable levels. In 2025, the average total phosphorus level in the epilimnion, across all 16 lakes, was 0.03 mg P/L — three times the EPA guideline for phosphorus. Phosphorus levels in the hypolimnion were even higher and averaged 0.21 mg P/L. Pike, Silver, and Beaver Dam lakes continue to be the most nutrient-rich lakes, followed closely by Yellow Creek and Big Barbee.
Nearly half of our study lakes have nitrogen levels in the epilimnion well above the EPA standard of 0.43 mg N/L. Similar to phosphorus, Pike, Silver, and Beaver Dam show the highest levels of total nitrogen. Big Barbee and Winona also have high levels of total nitrogen in the epilimnion and hypolimnion. On average, total nitrogen levels in 2025 were 0.97 mg N/L and 2.44 mg N/L in the epilimnion and hypolimnion, respectively, and greatly exceeded the EPA guidelines.
In most cases, lakes with high levels of total phosphorus typically have high levels of total nitrogen. If you compare the two epilimnetic graphs, you can see that they track similarly as you move from lake to lake. Despite having total phosphorus concentrations similar to the EPA recommended levels, total nitrogen concentrations in Waubee Lake are quite high — especially in the epilimnion.

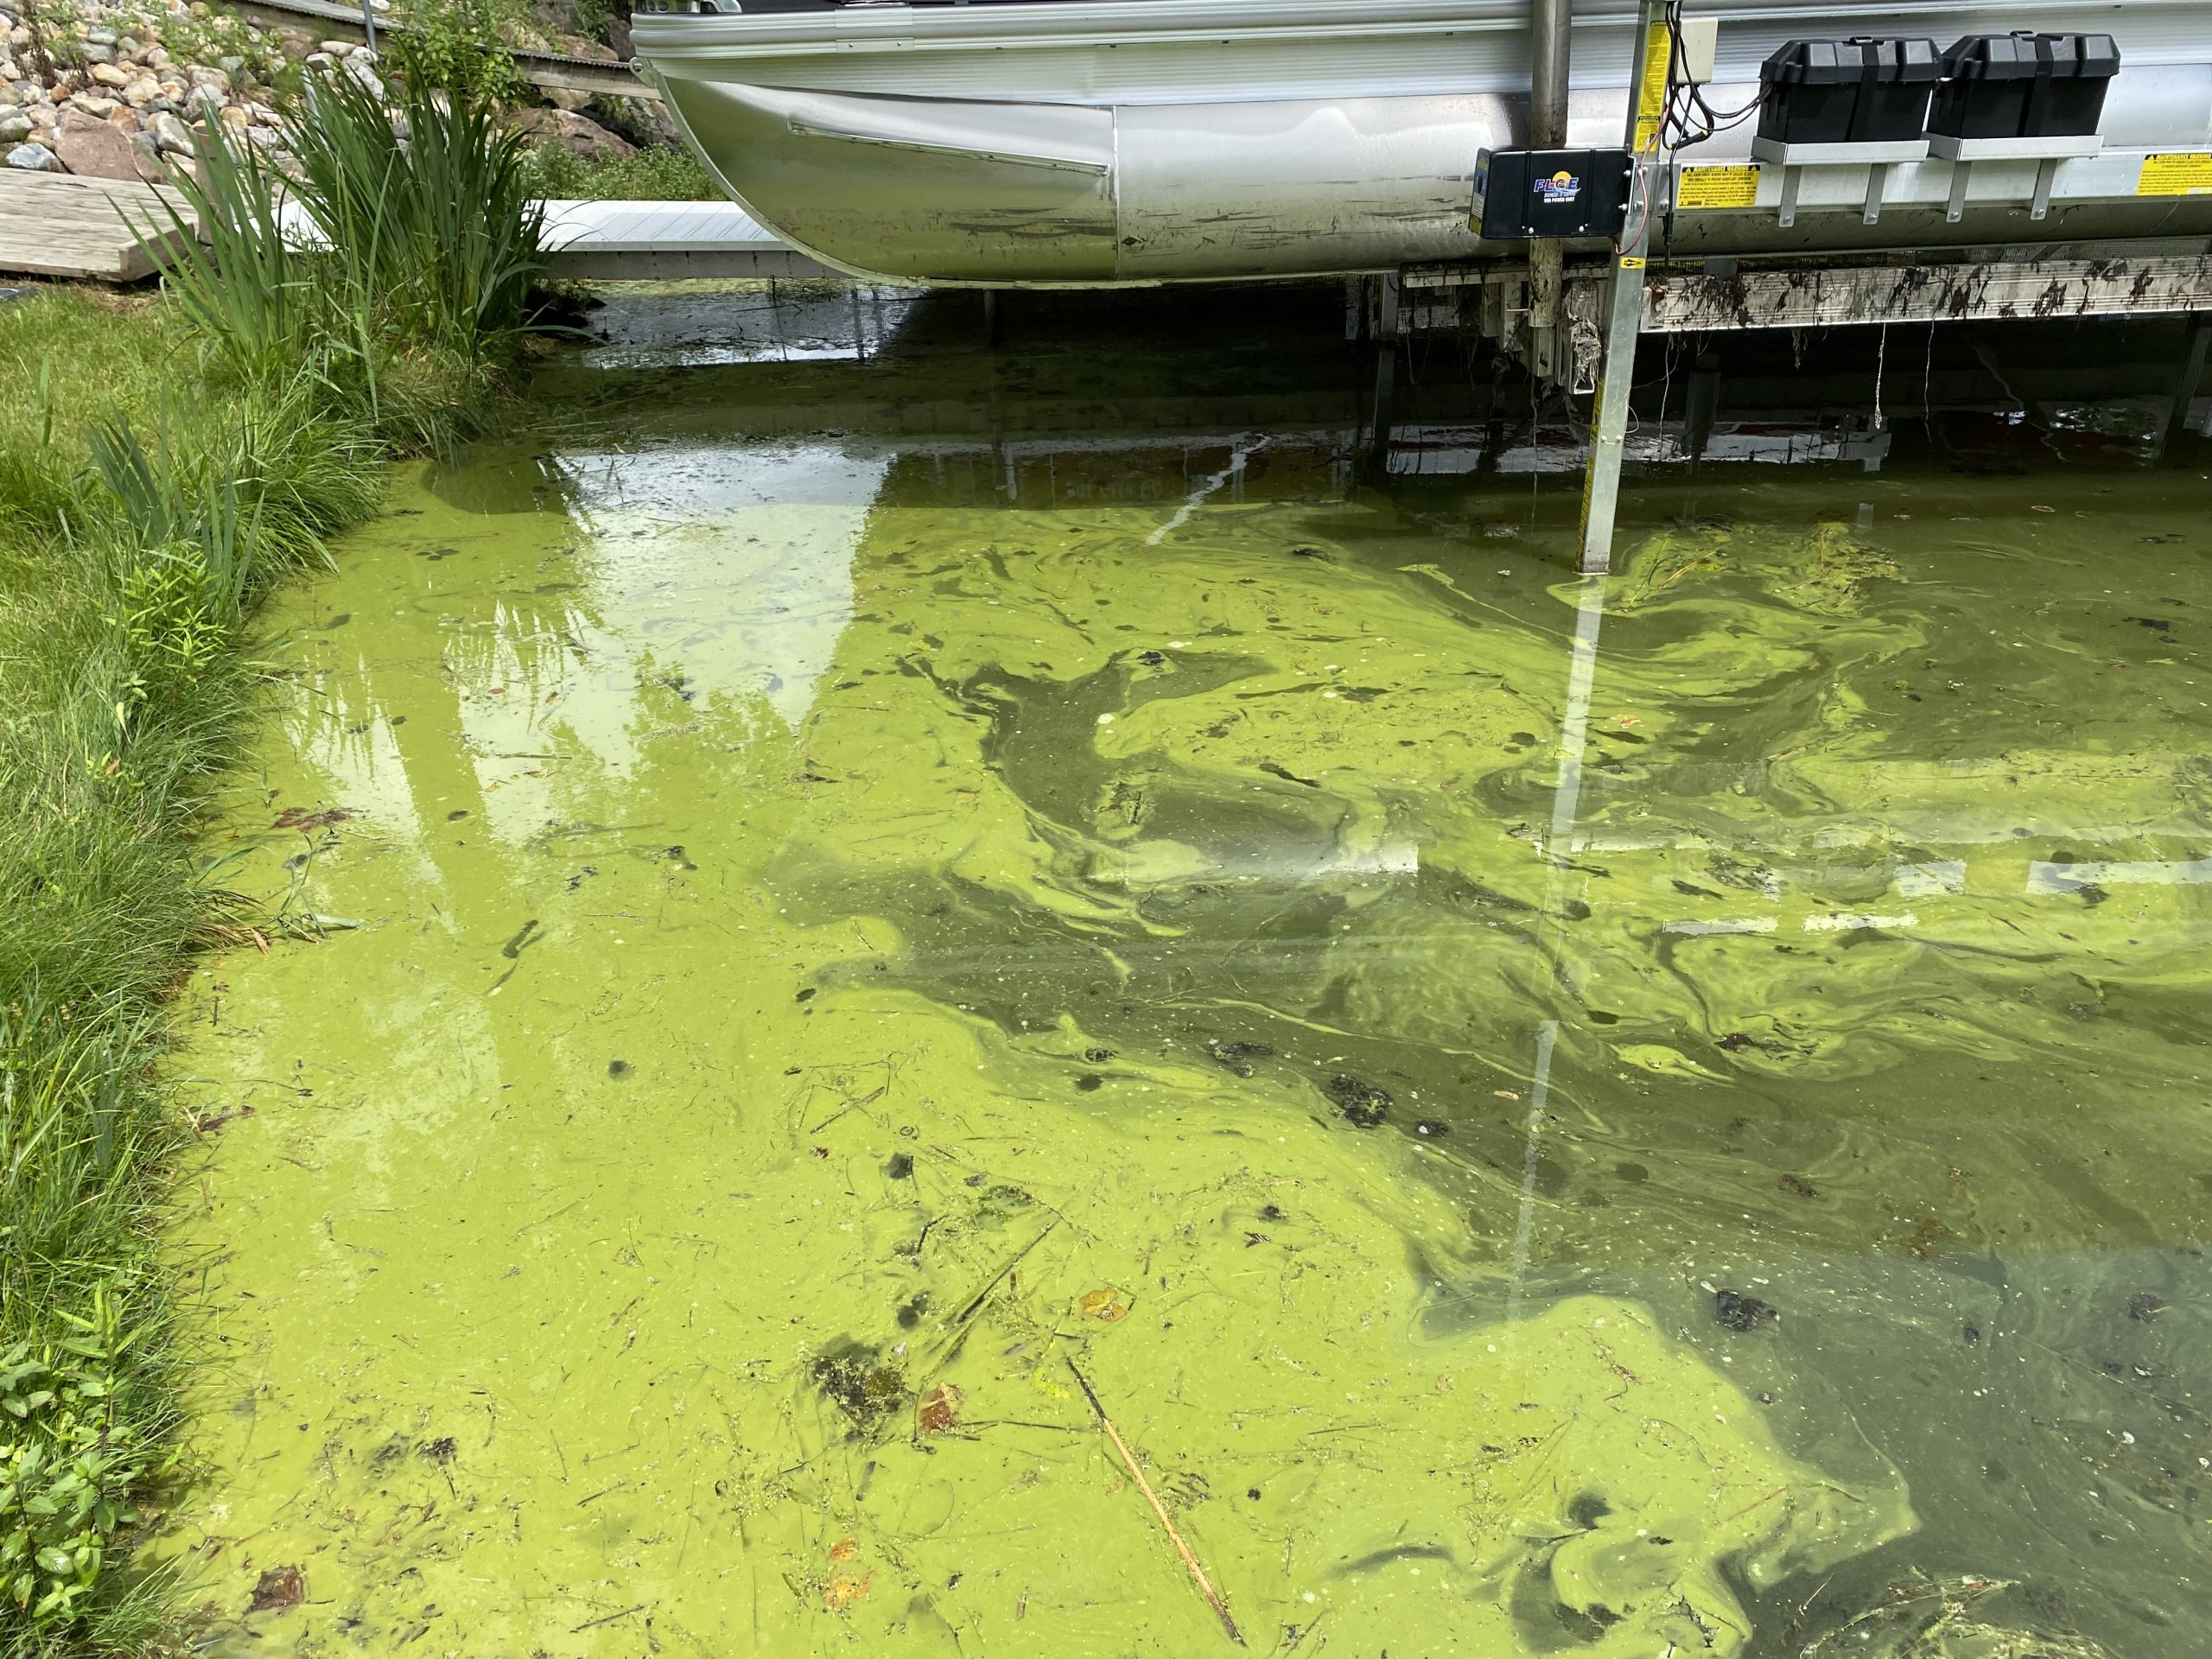
Blue-green algae and microcystin
Research on blue-green algae (BGA) is happening around the world. Blue-green algae is a natural freshwater bacteria that can produce toxins — a more accurate name for blue-green algae is cyanobacteria. Scientists are working to correlate nutrient data, environmental data, and algae populations to toxin production. The goal? Make lakes safe for people and pets to recreate. Although cyanobacteria are abundant in our lakes, data show that microcystin toxins are usually below the safety threshold for pets (0.8 ppb).
While 2024 began wet and warm, kick-starting a summer of above-average microcystin concentrations, the summer of 2025 started cool and dry. This resulted in better water clarity than normal, well into June. However, a heat wave and subsequent rain following the early dry summer period prompted BGA blooms, many of which produced toxins. The average microcystin concentration this year (0.38 ppb) was lower than in 2024 (0.52 ppb), but still higher than the average recorded in 2023 (0.22 ppb) or 2022 (0.24 ppb). Six lakes had elevated microcystin levels in 2024. This summer, Silver, Waubee, and Wawasee had elevated toxin levels, which led to an increased average concentration.
Blue-green algae and saxitoxin
The Lilly Center continues to investigate saxitoxin, another toxin produced by cyanobacteria. Both freshwater and saltwater cyanobacteria are capable of producing saxitoxin. In marine environments, saxitoxin is produced by the same organisms responsible for red tide. Like microcystin, saxitoxin can cause harm to pets (0.05 ppb) and humans (0.8 ppb) at elevated levels.
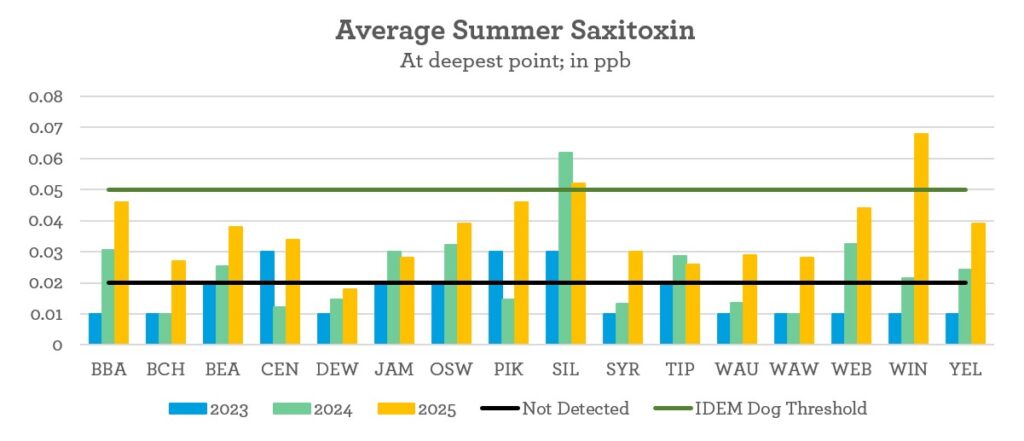
This graph shows average summer concentrations of saxitoxin, measured at the deepest points of 16 area lakes in 2023, 2024, and 2025. In all lakes and years, concentrations were far below the human health threshold of 0.8 ppb. However, some lakes did surpass the IDEM advisory threshold for dogs of 0.05 ppb. In 2024, average toxin levels at Silver Lake exceeded this dog safety threshold, while in 2025, both Silver Lake and Winona Lake averages reached levels at or just above it. Roughly one-third of the samples from both lakes exceeded 0.05 ppb. Other lakes, including Big Barbee, Beaver Dam, Center, Pike, Syracuse, Webster, and Yellow Creek, showed increases in 2025 compared to earlier years, though still below the pet threshold. Overall, saxitoxin was consistently detected across the lakes, with modest year-to-year increases. But most concentrations remain at levels considered safe for both people and pets.
More information is needed to better understand saxitoxin and its correlation to algae species. The Lilly Center will continue studying this toxin to ensure that our communities are safe.
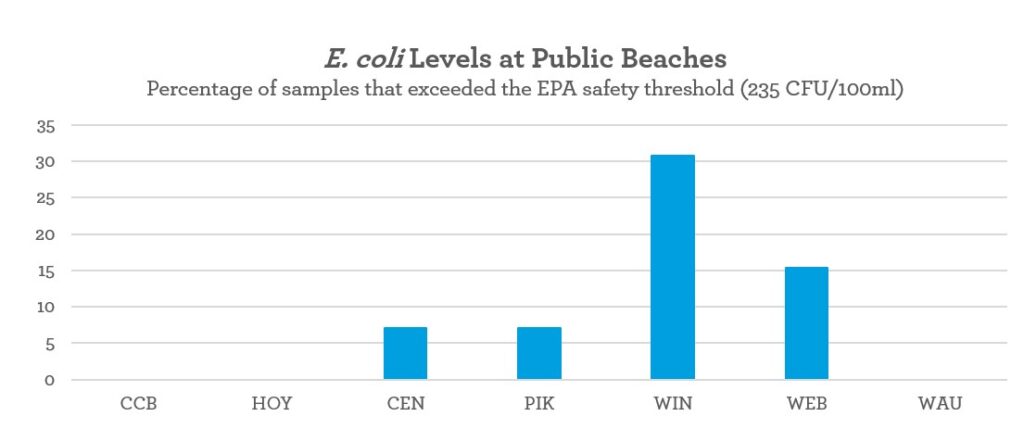
E. coli
Cyanobacteria and E. coli are both bacteria. Unlike cyanobacteria, E. coli is predominantly found in the intestines of warm-blooded animals, including humans. E. coli can often persist in warm, stagnant water. Most E. coli is harmless, but some strains can pose a health risk.
The Lilly Center’s research lab is now certified to test for E. coli by the Indiana State Department of Health. This certification gives us great confidence in our procedures and data. By understanding E. coli better, we can identify the presence of excess nutrients and eventually address the source.
Testing at public beaches showed that most locations met state safety standards for E. coli. At the Community Center and Hoy beaches on Syracuse Lake, as well as at Waubee Lake, none of the samples exceeded the Environmental Protection Agency (EPA) safety limit. Center Lake and Pike Lake had only a small number of exceedances, with about 7–8% of samples testing above the threshold. Webster Lake had a moderate number of exceedances at around 16%. Winona Lake stood out with the highest levels of concern, as nearly one-third of the samples were above the safety standard. These results show that most local beaches are generally safe for swimming. However, Winona Lake Beach presents a greater potential health risk and should be monitored closely.
How do nutrients get into the lakes?
Streams, lawns, storm drains, pipes, decomposing materials already in the lake … the list is almost endless! Nutrients are essential for a lake’s health, but too many nutrients can be a bad thing.
Where can I see last year's Beneath the Surface?
Use the buttons below to download previous editions of Beneath the Surface.
What's going on in MY lake, and how can I get involved?
We study 16 lakes, all of which are represented in Beneath the Surface:
- Beaver Dam Lake
- Big Barbee Lake
- Big Chapman Lake
- Center Lake
- Dewart Lake
- James Lake
- Oswego Lake
- Pike Lake
- Silver Lake
- Syracuse Lake
- Lake Tippecanoe
- Lake Wawasee
- Waubee Lake
- Webster Lake
- Winona Lake
- Yellow Creek Lake
Download a copy to find out the current state of your lake’s health.
Want to get involved at the lake-level? Find out if your lake has a lake association, or if one of the many local governmental/conservation associations is taking volunteers. Here are the ones we regularly partner with.
BARBEE LAKES PROPERTY OWNERS ASSOCIATION
North Webster, IN | barbeelakes.org
BEAVER DAM & LOON LAKE CONSERVATION CLUB
Claypool, IN | Find them on Facebook
CENTER LAKE CONSERVATION ASSOCIATION
Warsaw, IN | Find them on Facebook
CHAPMAN LAKES CONSERVATION ASSOCIATION
Warsaw, IN | chapmanlake.com
DEWART LAKE PROTECTIVE ASSOCIATION
Syracuse, IN | dewartlake.org
LAKE TIPPECANOE PROPERTY OWNERS ASSOCIATION
Leesburg, IN | ltpo.org
PIKE LAKE ASSOCIATION
Warsaw, IN | Find them on Facebook
WAWASEE PROPERTY OWNERS ASSOCIATION
Syracuse, IN | wawaseepoa.org
WEBSTER LAKE CONSERVATION ASSOCIATION
North Webster, IN | lakewebster.net
WINONA LAKE PRESERVATION ASSOCIATION
Winona Lake, IN | winonalakepreservation.com
SYRACUSE LAKE ASSOCIATION
Syracuse, IN | Find them on Facebook
YELLOW CREEK LAKE CONSERVATION CLUB
Claypool, IN | Find them on Facebook
CITY OF WARSAW STORMWATER UTILITY
Warsaw, IN | warsaw.in.gov/301/stormwater-utility
U.S. ENVIRONMENTAL PROTECTION AGENCY
epa.gov
INDIANA DEPARTMENT OF ENVIRONMENTAL MANAGEMENT
Indianapolis, IN | in.gov/idem
INDIANA DEPARTMENT OF NATURAL RESOURCES
Indianapolis, IN | in.gov/dnr
KOSCIUSKO COUNTY CONVENTION, RECREATION AND VISITORS COMMISSION
Warsaw, IN
KOSCIUSKO COUNTY SOIL AND WATER CONSERVATION DISTRICT
Warsaw, IN | kosciuskoswcd.org
THE WATERSHED FOUNDATION
North Webster, IN | watershedfoundation.org
WAWASEE AREA CONSERVANCY FOUNDATION
Syracuse, IN | wacf.com
Beneath the Surface is made possible by The Papers, and the Lilly Center’s blue-green algae research is supported by K21 Health Foundation, among many others generous families and individuals. Thank you!